7th Grade Unit 2 Introducing Proportional Relationships
- BIG IDEA #1 Representing Proportional Relationships with Tables
- BIG IDEA #2 Representing Proportional Relationships with Equations
- BIG IDEA #3 Representing Proportional Relationships with Graphs
REPRESENTING PROPORTIONAL RELATIONSHIPS WITH TABLES
This week your student will learn about proportional relationships. This builds on the work they did with equivalent ratios in grade 6. For example, a recipe says “for every 5 cups of grape juice, mix in 2 cups of peach juice.” We can make different-sized batches of this recipe that will taste the same.
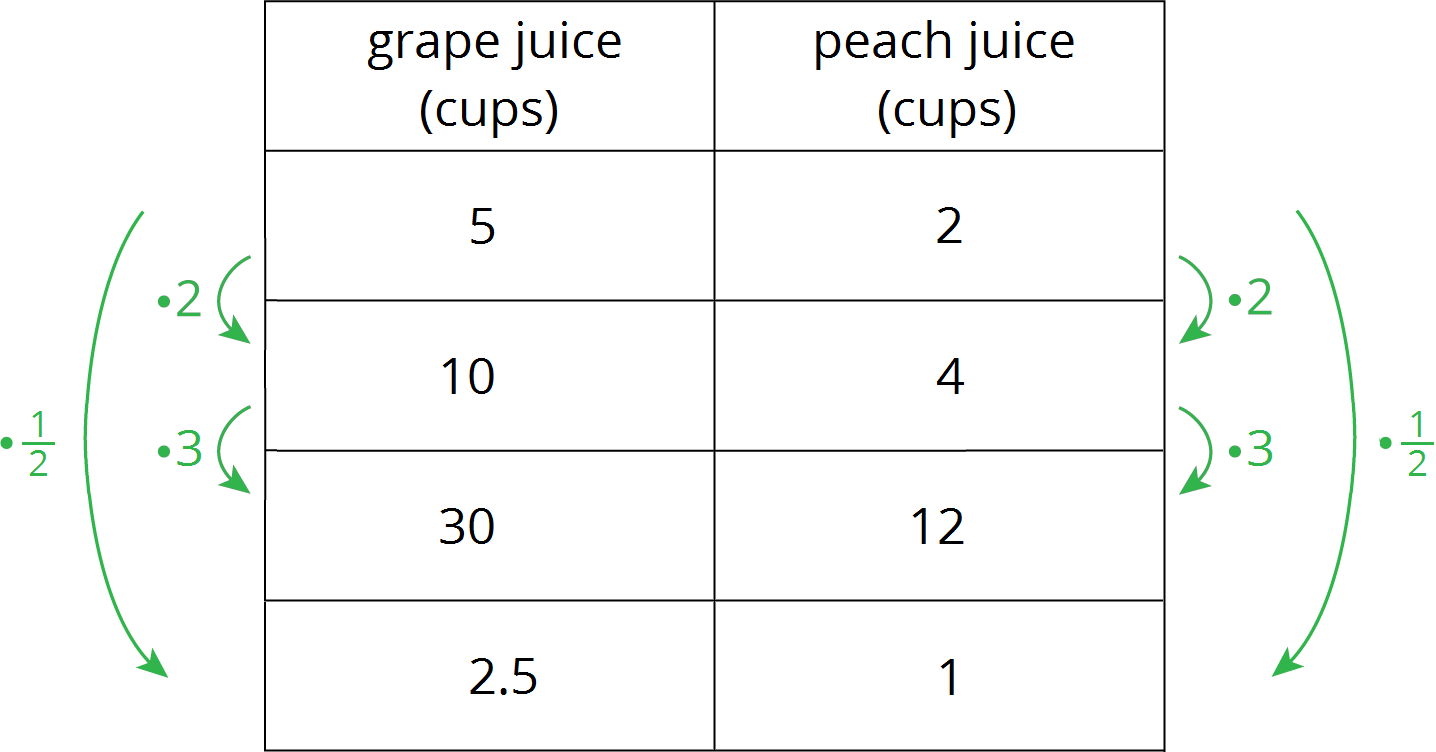
The amounts of grape juice and peach juice in each of these batches form equivalent ratios.
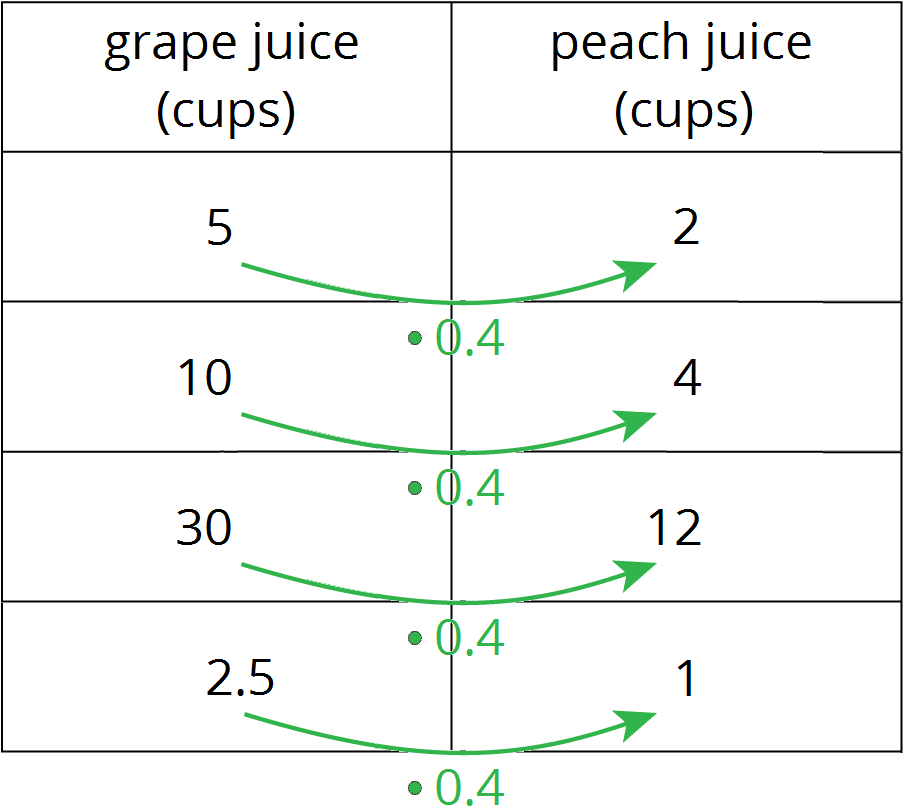
The relationship between the quantities of grape juice and peach juice is a proportional relationship. In a table of a proportional relationship, there is always some number that you can multiply by the number in the first column to get the number in the second column for any row. This number is called the constant of proportionality.
In the fruit juice example, the constant of proportionality is 0.4. There are 0.4 cups of peach juice per cup of grape juice.
Here is a task you can try with your student:
Using the recipe “for every 5 cups of grape juice, mix in 2 cups of peach juice”
- How much peach juice would you mix with 20 cups of grape juice?
- How much grape juice would you mix with 20 cups of peach juice?
Solution:
- 8 cups of peach juice. Sample reasoning: We can multiply any amount of grape juice by 0.4 to find the corresponding amount of peach juice, 20⋅(0.4)=8.
- 50 cups of grape juice. Sample reasoning: We can divide any amount of peach juice by 0.4 to find the corresponding amount of grape juice, 20÷0.4=50.
REPRESENTING PROPORTIONAL RELATIONSHIPS WITH EQUATIONS
This week your student will learn to write equations that represent proportional relationships. For example, if each square foot of carpet costs $1.50, then the cost of the carpet is proportional to the number of square feet.
The constant of proportionalityin this situation is 1.5. We can multiply by the constant of proportionality to find the cost of a specific number of square feet of carpet.
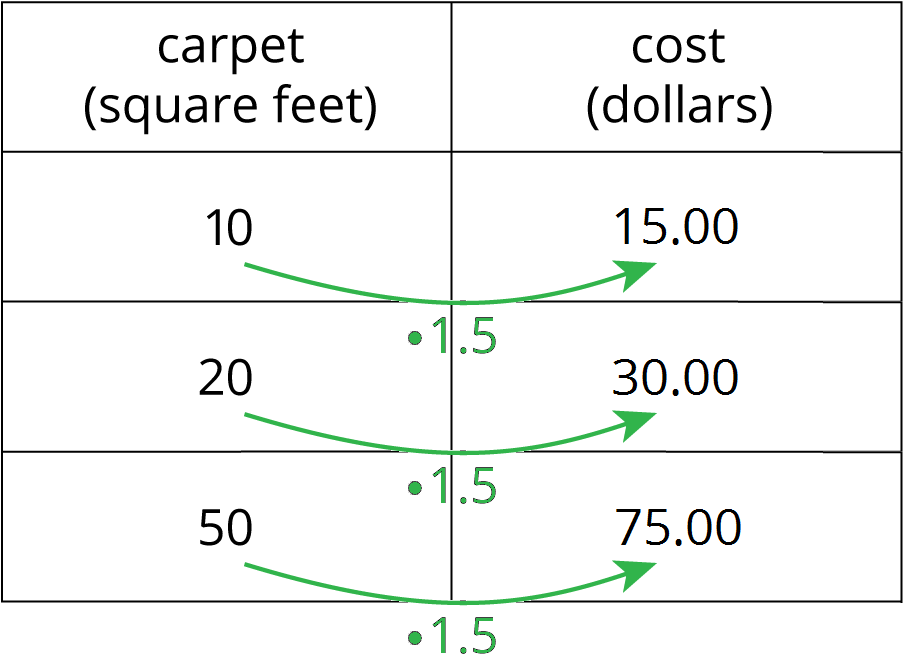
We can represent this relationship with the equation c=1.5f, where frepresents the number of square feet, and c represents the cost in dollars. Remember that the cost of carpeting is always the number of square feet of carpeting times 1.5 dollars per square foot. This equation is just stating that relationship with symbols.
The equation for any proportional relationship looks like y=kx, where x and y represent the related quantities and k is the constant of proportionality. Some other examples are y=4x and d=13t. Examples of equations that do not represent proportional relationships are y=4+x, A=6s2, and w=36L.
Here is a task to try with your student:
- Write an equation that represents that relationship between the amounts of grape juice and peach juice in the recipe “for every 5 cups of grape juice, mix in 2 cups of peach juice.”
- Select all the equations that could represent a proportional relationship:
- K=C+273
- s=14p
- V=s3
- h=14−x
- c=6.28r
Solution:
- Answers vary. Sample response: If p represents the number of cups of peach juice and g represents the number of cups of grape juice, the relationship could be written as p=0.4g. Some other equivalent equations are p=25g, g=52p, or g=2.5p.
- B and E. For the equation s=14p, the constant of proportionality is 14. For the equation c=6.28r, the constant of proportionality is 6.28.